In version 20.2 came a lot of nice features with among other things improvements to ORDS integration and more Liquibase features. But by far the one I liked the most was debugging. “but we’ve had debugging forever”. True, but if your database is in the cloud or in a datacenter where NAT or such things are used, you have not been able to use it as it requires traffic initiated from the database server to your PC and that is often not possible with the pre 20.2 version of debugging. The database cannot route to your PC when all traffic from workstations are multiplexed to a single address. For a datacenter your PCs address may well be something very many customers has for their employees machines.
What is needed is a debug session that can be initiated by yoru machine and managed in that session. That has not been possible before.
With SQL Developer 20.2 you can initiate it from SQL Developer, then the debug session is created as usual but the connection to it is then done by a session being initiated from SQL Developer to that session i the database. After that it all works just as the old way did when you had the networking access to use it.
Enough about how it works, how do you get SQL Developer to take advantage of this feature?
You obviously need to upgrade your SQL Developer if you have an earlier version.
Now with a current version of SQL Developer, let’s head to preferences. (Tools -> Preferences)

Note the option to select between DBMS_DEBUG_JDWP and DBMS_DEBUG. You want to select DBMS_DEBUG.
With that change you can now klick on the bug to start debugging ![]() .
.
But before it lets you actually get into the code and step through it, you need to compile it for debug. Without that no breakpoints or other debugging features will work.

With that compile completed, you can just press F5 on a line or right click in the margin to set a breakpoint so there is at least one place for the code to stop at.
If you press the bug-icon now, you’ll get the following dialog to adjust both the call and what you want it to do afterwards. I usually just modify values for the input parameters and possibly if I want anything to be printed afterwards.

In this case I’ve modified the value of the parameter from NULL to 12. Press OK and next up you’ll be in the code stopped at your first breakpoint.
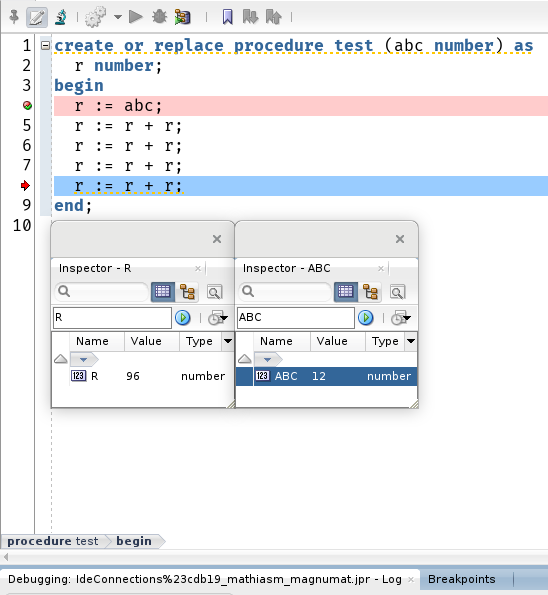
In the below screen capture I’ve stepped down a few lines and also added on watch for the input parameter and one for the variable.

It is also possible to change the value of parameters to see the effect. Or to do any other things you usually do in a debugger in an IDE. To learn more about that, play around and look for the things you would want to take a look at the documentation.
Leave a Reply